Chapter 6 Reporting the Study
6.1 Basic steps to reporting the study

“Figure out the one central and novel contribution of your paper. Write this down in one paragraph.” (Cochrane 2005, 1)
At this stage you need to report all your performed work in detail in a scientific research paper.
When reporting the study you should provide readers with the necessary information to reproduce every table and figure; to assess the appropriateness of methods used, given your settings and data, and its contribution and conclusions, given your results.
A research paper usually includes the following sections:
- Title
- Abstract
- Introduction
- Previous Literature
- Background (optional)
- Data and Variables
- Empirical Methods
- Results
- Discussion
- Summary and Conclusion
- References
- Appendices
We briefly summarize each of these items, based on Cochrane (2005), Dudenhefer (2014), Martin (2018), and Plamen (2020):
Figure 6.1: How to report your paper
The Title should be short (15 words or less) and reflect your research question. It usually contains the purpose (what is the question you are addressing?) and scope (if you cover a specific time period or population) of the study. You might also include the methods of your study in the title, if, e.g., you conduct a cohort study or use a new identification method. All this information should help readers to decide whether or not they are interested in reading the paper.
The Abstract is usually around 150 words or less and includes a very short summary of your research question, main contribution, data and methods used, main findings, and conclusions.
The Introduction is the most important part of the paper as it has to grab the readers’ attention. It should motivate your research topic and give a more extensive overview of the context, your contribution, data, methods, and findings. You provide context by referencing the existing literature regarding what we know and what we do not know about the topic. You parlay the latter part into your research question. An important aspect of introduction is to highlight what contribution your paper makes, and how it relates to and improves previous work on the topic.
You need to raise the interest of your readers to a degree that they would want to continue reading the rest of your paper. Therefore, it is advisable that you write this section at the very end.
It should be structured as a newspaper article – where you first deliver the main message and information, and then provide details – rather than a novel- – where you first build up the narrative and only reach the story punchline at the very end.
At the end of this section you could write a roadmap that briefly guides the reader through your paper. Overall, the whole section should not take up more than 3 pages.
Once you choose your topic and pose a research question, the first thing you usually do is look at the related previous literature. The Previous literature review is a standard in economic papers and constitutes a significant part of your empirical project. It is either included in the Introduction or is placed in a separate section.
The main purpose of the review is to show the reader that you are familiar with the main scholarly work in the field; to critically review the most relevant and influential (well-cited) studies on the topic; to place your study in the context of other studies; and to convince the reader of the need to conduct the research in question, and to show how it fits into and contributes to the study field (Are you using new data or identification strategy? Are you answering a question more specifically? How are you improving on previous papers?).
It helps you to establish whether the topic has been researched before, to identify limitations of previous research and still open research gaps. You do not need to mention every published paper on the topic, but you do need to cite the most important studies in the area and distinguish your paper from them. Literature reviews are selective: you only include papers that are relevant for your argument.
Importantly, a literature review should not simply consist of a series of paragraphs that summarize papers in no particular order. Instead, a good literature review should be carefully constructed to tell a specific story: this is what others have done on my topic; this is what is unsatisfactory or missing from that research; and here is how I am going to fill this researh gap. Thus, through your literature review you “sell” the value addded of your paper.
In a literature review, you need to identify and summarize key scholarly publications from the fields that are pertinent to your research topic. It should involve a thorough search of the main key words in the relevant databases and journals. To organize your literature search, you can create a spreadsheet, where you include study and author(s) names, publication journal and year, identification strategy, main resuts, caveats and comments. Always take notes on the papers you read. This will help you to summarize and organize your review once you are ready to write it.
Sometimes a paper might contain a Background section that provides background information about a historical event or context, a specific country’s health care system, or details about a specific policy or program under investigation.
The Data and Variables section should contain a detailed information about the data sources used in the paper as well as information about the variables used in the analysis. Identify your data sources and describe them, i.e. data-generating process, the unit and the number of observations, the population groups sampled, the time period during which the data were collected, the method of data collection, type of data (cross-sectional, panel, time series), main variables for your reseaarch question, etc. Mention any data limitations that might influence your results, i.e. small number of observations, survey response, missing observations, attrition or selection bias, over or underrepresentation of certain populations, etc.
Describe your sample and variable selection in great detail: how you construct your sample and which data manupulations you perform. Provide descriptive statistics and graphs. Descriptive statistics usually include means and standard deviations of variables you use in your analysis. Sometimes you need to present these statistics for different subgroups, e.g., treatment and control, post and pre treatment. Point here to the patterns that are easily observable from the summary statistics that can help the reader better understand your analysis.
Generally, a good way to learn how to write a data section is to look in the related literature and pay attention to the information it includes.
The Empirical method section should in great detail describe the statistical method used in the paper and the assumptions that are necessary to be fulfilled to get an unbiased and consistent estimation of your parameter of interest. Write whether you weight the data or use certain fixed effects. Also describe the empirical problems and how you address them. Ideally, you should describe each step that readers should perform, if they would like to reproduce your results and conclusions.
You need to explain the appropriatness of the method you choose for the specific context. You need to write down your econometric equation and explain how variables are defined and measured. Mention key parameters of interest.
The Results section should contain a set of tables and figures that show your main empirical results. Make sure that tables are reader-friendly and are easy to comprehend. Place figures and tables as close as possible to the place in the text where you first refer to them. Do not report all the variables incuded in the regression, but only present the results and parameters that directly relate to your main hypothethis and story. Including too namy parameters and results can distract the readers from your main point. Thus, guide the readers and focus their attention only on the most important results from your anaylsis and in the right order.
Do not provide any interpretations or speculations here. Keep it factual and simply describe in words what the tables and figures display. Comment on the economic significance of your results, not just their statistical significance. After the main results, discuss potential biases and shortcoming to the internal validity and suggest ways to check them. Place secondary results and your response to potential criticisms and robustness checks into your Appendix.
The Discussion section contains the interpretation and discussion of the results, as well as potential mechanisms, and suggests a direction for future research.
Start your discussion by reiterating your research question and, based on your findings, state what you think an answer to your question is. Do not introduce any new data or results in this section. It should reflect only the results already presented in the paper. Interpret your results in the context of the literature that you identify and discuss in the Introduction and the Previous Literature sections (Are your findings consistent with what the other literature has found? Do your data fill the gap in the knowledge that you identify?). Here you want to show how your work adds to and extends the knowledge on the topic.
You can also discuss implications of your study for public policy. You also should acknowledge and discuss the limitations of the study here and what implications these limitations might have for the results. The more accurate, open and detailed you are about the limitations, the more credibility your results will have. Suggest alternative interpretations and other possible mechanisms that can explain your findings. You can also talk about next steps and the implications of your findings for future research.
The Summary and Conclusion section should be short and sweet (a few concise paragraphs). It contains the most important information on the topic, findings and concluding remarks. It should mirror main points mentioned in the Introduction. You should underline why your research matters and state the answer to your research question. Also state here any recommendations that can be made based on your findings.
At the very end of your paper you need to provide a complete list of References. The bibliography includes a compete list of academic papers and books referenced and cited in your study. Make sure that all your in-text citations appear in the reference list at the end of the paper.
The easiest way to keep track of your reference list is to write down the information, i.e. the title, author(s), journal/book, publisher, and publication date, about the original source each time you use it. Decide in advance on one citation and reference style and follow it consistently throughout the paper.
The Appendices are a handy tool that allows you to save space. As a careful researcher you will conduct a series of robustness checks of your main results. However, once you confirm that the results are stable, to keep your paper focused and not too long you can move all the still relevant, but secondary and less critical information in appendices. You should summarize what you did in the main body of your paper and include an in-text reference to the information in the appendix. Most journals provide possibilities of an online appendix or supplementary material.
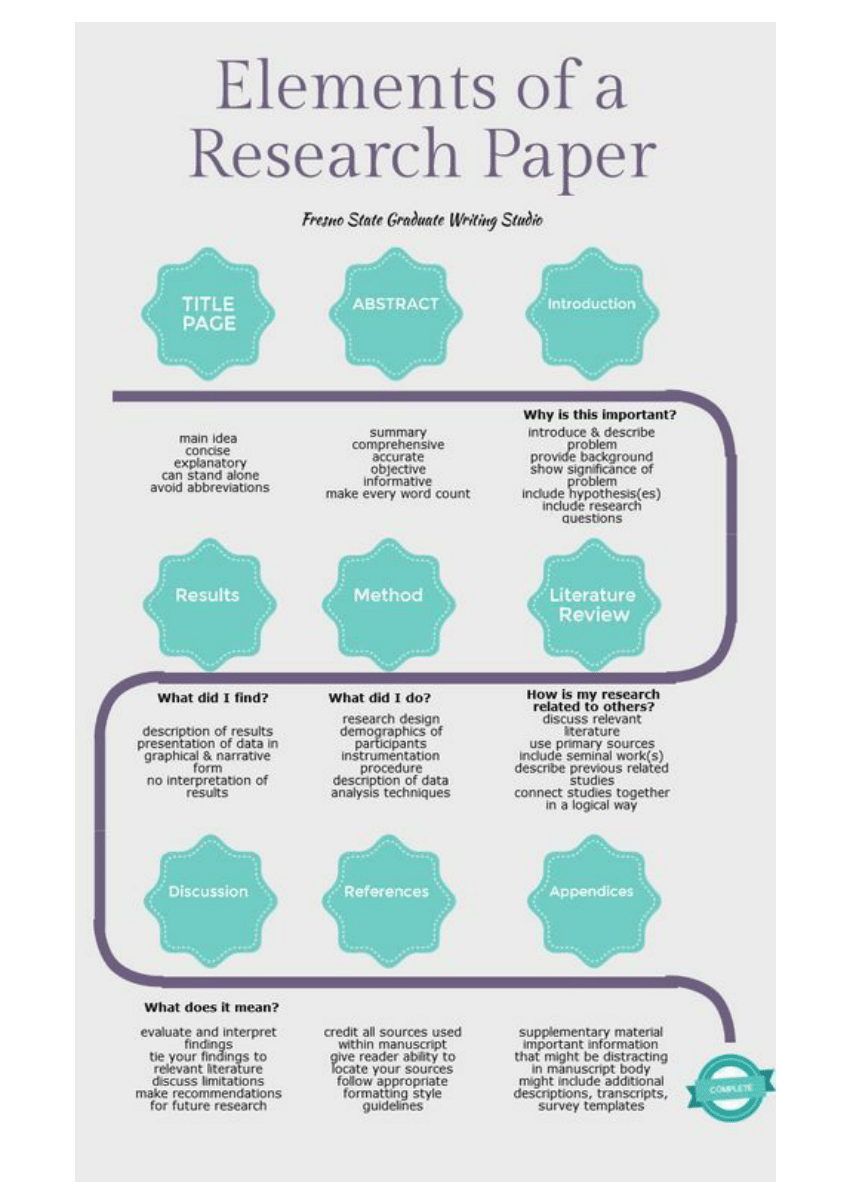
(#fig:paper_structure)Paper Structure
Source: Fresno State Graduate Writing Studio. Elements of a Research Paper.
6.1.1 The writing process, tips based on Cochrane (2005) and Dudenhefer (2014)
- Producing a good empirical paper takes time. You should start working on it and drafting it as soon as possible.
- Allow yourself sufficient time for collecting and analyzing the data, writing and revising the paper. Writing a paper is a recursive process that takes many revisions.
- Read the text yourself and let others read it. (“Is the text interesting to read?”, “Would you want to read beyond the introduction yourself?”)
- Shorter is better: keep the paper short as possible. Every word must count. When editing always ask yourself whether you can make the same point with fewer words.
- Avoid repetition. It uses extra space and tests readers’ patience. If it is possible to cut a word, sentence or paragraph, then cut them out.
- Keep track of your resources as you work on your ideas. Do not rely on your memory when you come across information you might use in your paper. Invest in acurate note-keeping from the start. It will save you time and extra work when you draft your paper.
- Pay attention to the writing style in the papers you read and admire; carefully analyze what information they contain and how they put it together.
- Remember, no one can learn to write simply by reading a few manuals and tips on the topic. You can only do it by practicing.
More principles on writing in economics are summarized in Top Ten Rules of Economical Writing and more comprehensively in McCloskey and Ziliak (2019) and by Hall (2013).
6.1.2 General guidance on writing and use of language in a research paper
These tips are a collection of Cochrane (2005), Lund University, and Plamen (2020).
- Do not use slang, jargon, or colloquialisms. Always use formal language.
- Do not use common vocabulary, such as have got, the other thing. Make more formal vocabulary choices, e.g., have found, the other issue/problem/notion/idea etc..
- Do not use shortened verb forms, such as they’re, isn’t, can’t, don’t. Use the full verb form instead, e.g., they are, is not, cannot.
- Do not use subjective language, i.e. I think, we assume. Use objective language.
- Avoid using past or future tenses. Use present tense and generally stick to one tense: “This paper attempts to…”, “Hellerstein (1998) finds that…”; “Table 1 shows…”
- Do not use passive voice, i.e. It has been shown in the paper by Hellerstein (1998). Use active voice, i.e. Hellerstein (1998) shows…
- Do not use needless words and information that clutter the writing. Use simple and direct sentences, and keep them short. For example, change “in order to” to “to”, ”whether or not” to “whether”, “is equal to” to “equals”, “it should be noted” to “notably”.
- Place minor or secondary details and digressions from the main text into footnotes, but use them sparingly.
- Use “I” in a single-author project, and “we” in the project with more than one author.
- Do not plagiarize. Provide references and citations whenever you say something that is not your own. Proper referencing and citations prevent acusations of plagiarisms, allow to acknowledge your sources, give credibility to your work, and demostrate your knowledge in the subject area.
- Use in-text citations: “Hellerstein (1998) finds that…” Do not write “Judith Hellerstein in 1998 journal article finds that…”
- Do not mix British and American English, citation styles, tenses, and different word spellings (e.g., health care vs healthcare, data set vs dataset, policy makers vs policymakers, socio-economic vs socioeconomic, behaviour vs behavior etc.). Be consistent in the use of language and style.
- Remember that “long-run” as an adjective uses hyphen, while “long run” as a noun does not.
- Use automatic spellcheck, but never rely on it completely. Always double check for tricky words and proofread the text. Ask others to read it.
- Do not get complacent after finishing the first draft of the manuscript. Revise, rewrite, polish, carefully proofread and spellcheck. Control the word count.
- Read a copy of Strunk, W. Jr & White E. B. (1972). The Elements of Style and Zinsser, W. (2001). On Writing Well.
6.1.3 Tables, tips based on Cochrane (2005)
- Each table should be self-explanatory. Give your variables in the table self-explanatory names.
- Use 2 to 4 digits after the comma when reporting the results, not all the numbers produced by the statistical program. Apply this rule consistently for all the tables in your paper.
- Show results with and without controls. For example, start with a column that includes only the main coeffitient(s) of interest and then progressively inlcude various controls (e.g., patient characteristics, hospital/physician fixed effects, etc.) in subsequent columns.
- Include standard errors together with your coefficients.
- Indicate the source of the data at the bottom.
6.1.4 Figures, tips based on Cochrane (2005)
- Use figures to show patterns in the data – they demonstrate it better than tables with numbers.
- Label the axes properly.
- Add clear legends.
- Do not color your figures since some readers will view/print your paper in the black-and-white mode.
- Provide self-explanatory captions.
- Indicate the source of the data at the bottom.
6.2 Resources box
6.2.1 Collections of writing tips and short articles
- Dudenhefer, P. (2014). A guide to Writing in Economics. EcoTeach Center and Department of Economics, Duke University.
- Plamen, N. (2020). Writing tips for economics research papers
- Cochrane, J. H. (2005). Writing tips for Ph.D. students. Chicago, IL: University of Chicago.
- Top Ten Rules of Economical Writing
6.2.2 Books
- Hall, G. M. (Ed.). (2013). How to write a paper (5th ed). Wiley-Blackwell.
- McCloskey, D. N., & Ziliak, S. T. (2019). Economical Writing, Third Edition: Thirty-Five Rules for Clear and Persuasive Prose (Third Edition). University of Chicago Press.
- Strunk, W. Jr & White E. B. (1972). The Elements of Style - great general writing style book
- Zinsser, W. (2001). On Writing Well
6.2.3 Videos
6.2.4 Online resource
6.3 Checklist to reporting the study
- Start writing early. Edit your text a lot to improve it.
- Make sure you follow your one central research question.
- Ensure you cover and include all relevant sections of a research paper.
- Concentrate on the most important tables and figures for your main text.
- Plan ahead for proof-reading and editing the text you have written.
- Be able to read your own paper with some time distance.
6.4 Example: Hellerstein (1998)
We go over each section of the manuscript to highlight its role to Hellerstein’s research article. The structure contains the following parts:
Title
Abstract
Introduction
Background and related literature
- Medical
- Legal
- Institutional
Empirical motivation and summary statistics
The model
Empirical implementation
Estimation results
Conclusion
Appendices
References
6.4.1 Title
The paper title consists of 12 words that reflect the paper’s research question.
6.4.2 Abstract
In the abstract Hellerstein gives a short overview on the paper by mentioning the topic, the data, the results and their takeaway.
6.4.3 Introduction
The introduction to the study is short. Hellerstein starts it by highlighting a welfare-enhancing potential of substituting trade-name drugs with generics, creating relevance for her topic. Next, she elaborates her research question, followed by a short overview of the results and their implications. She finishes with a structural overview of the rest of her paper.
Other common features of an introduction are missing here. These include an overview of the pre-existing research, contribution to different literature fields, and an overview of the methodological approach.
6.4.5 Empirical motivation and summary statistics
Hellerstein uses this chapter for two things: to introduce her sample and to show heterogeneities in generic prescription rates in her sample. The first part of the chapter is thereby built as follows:
- An introduction of the raw data
- An elaboration on data clearing processes
- A descriptive overview of the patient sample (NAMCS) and the drug-level subsample (NAMCSd). The variables used for descriptive statistics will later reappear as covariates in the analysis.
The data introduction helps readers to understand the sample Hellerstein uses for her analysis; how it originates, what its properties are and how valid it might be for this particular research question. The remaining part of the chapter emphasizes descriptive differences in generic prescription rates. The heterogeneities Hellerstein focuses on are in particular:
- In generic prescription rates across drug classes.
- How frequent physicians prescribe generics.
- Whether physicians prescribe the same medication sometimes as generic and sometimes as trade-name version, or whether they stick with one option all the time. These patterns lay the foundation on why her empirical analysis is important. Further, the statistics in this chapter introduce and justify the inclusion of covariates in her model.
6.4.6 The model
Hellerstein clarifies from a theoretical perspective, what factors might determine a physician’s decision to prescribe a generic. Beyond clarifying the decision setup, Hellerstein’s analysis revolved around the model also serves as a hypothesis for her research question. In the formula, it is clearly defined when the insurance coverage (that closely correlates with the insurance status) nudges a physician towards prescribing a generic. Lastly, the model serves as an additional argument, what variables should be considered when empirically modelling the physician behavior.
6.4.7 Empirical implementation
In the first part of this chapter, Hellerstein elaborates how her theory lays framework for empirical application. Most parameters of her theoretical model are not included in the NAMCS data. She therefore discusses how to proxy missing elements using available variables. Next, she introduces her empirical model. First, she describes all variables and variable vectors that are included. Then, she discusses her choice of using a random effects estimator. The chapter concludes with a discussion of limitations and possible extensions to her empirical approach.
6.4.8 Estimation results
In the results chapter, Hellerstein again describes her regression model and presents the results. Further, she discusses concerns about her estimates and uses other specifications of her model to show the robustness of her results. Some results of the robustness tests are also reported. The chapter starts with a re-specification of her empirical application. Notably, the model described here deviates from the equation presented in the previous chapter. All estimated coefficients of this single regression are reported in 3 separate tables:
- Table 4: Coefficients of demographic variables and frequency of demographics per physician
- Table 5: Coefficients of drug class dummies
- Table 6: Coefficients of drug class x insurance type interactions.
In the text accompanying the tables, she picks numerous coefficients, provides possible explanations, and derives implications. Hellerstein mentions multiple limitations of her model and addresses concerns by a number of robustness checks. These include:
- Using a subsample of patients below age 65.
- Using a subsample of physicians with more than 20/30 patients in the overall NAMCS (results for both of these robustness tests are not reported).
- Using a subsample of observations from states with a special legal system (these results are reported).
- Hellerstein not only uses the results section to report her findings, but also to discuss their implications and limitations. Typically, this is done in a separate discussion section
6.4.9 Conclusion
Hellerstein starts her conclusion with a short summary of the research findings:
- What is the aim of her analysis?
- What are the key findings?
- What is the takeaway?
Hellerstein then closes her article with a discussion on how findings are relevant for future research and policy.
6.4.10 Appendices
The paper appendix consists of two parts:
- A methodological background on the random effects estimator Hellerstein uses
- Additional background information on the data and the data cleaning processes
6.4.11 References
Hellerstein lists all in-text references used in the paper in alphabetical order.
References
Cochrane, John H. 2005. “Writing Tips for Ph. D. Students,” June, 13. http://gsbwww.uchicago.edu/fac/john.cochrane/research/Papers/.
Dudenhefer, Paul. 2014. Guide to Writing in Economics. Duke University.
Hall, George M., ed. 2013. How to Write a Paper. 5th ed. Chichester, West Sussex: Wiley-Blackwell.
McCloskey, Deirdre N., and Stephen T. Ziliak. 2019. Economical Writing, Third Edition: Thirty-Five Rules for Clear and Persuasive Prose. Third Edition. Chicago ; London: University of Chicago Press.
Plamen, Nikolov. 2020. “Writing Tips for Economics Research Papers.” MPRA Paper, no. No. 105088. https://mpra.ub.uni-muenchen.de/105088/.