Chapter 7 Replication results of Hellerstein (1998)
We show the results of the replication of Tables 1-3 and Figures 1-2 of the descriptive analysis, and the replication of the empirical analysis in Tables 4-6 in this document. Our results are based on data from 1991 which is in contrast to Hellerstein (1998) that uses three datasets from 1989. As access to confidential data is required to identify physicians and patients in the 1989 data, we resort to the 1991 data that provide state identifiers in two publicly available datasets. We present our results and discuss deviations from Hellerstein (1998). A detailed discussion and interpretation is provided in the original study.
7.1 Descriptive Analysis
Summary statistics are shown in Table 1. They represent the patient sample from NAMCS in the year 1991. Results are similar to the summary statistics shown by Hellerstein (1998). Some categories of the payment sources differ slightly. Four categories – Self-pay, Medicare, Madicaid and HMO/prepaid plan – match. The categories Blue Cross/ Blue Shield and Other commercial insurer seem to have merged into the category Private/Commercial. When looking at the distribution of insurance coverage, we see that the frequency of patients with status Private/Commercial adds up to the frequencies of Blue Cross and other commercial insurers. Differences in the distribution of other covariates are slim. The most notable difference lies in the share of specialist physicians, which account for 68% of visited physicians in the 1991 sample compared to 55% in 1989.
Hellerstein Table 1 - Summary Statistics for Overall NAMCS Patient Sample
| Variable | mean | sd |
|---|---|---|
| Age | 43.07 | 24.81 |
| Female | 0.59 | 0.49 |
| Nonwhite | 0.11 | 0.31 |
| Hispanic | 0.06 | 0.23 |
| Self-pay | 0.22 | 0.41 |
| Medicare | 0.14 | 0.35 |
| Medicaid | 0.10 | 0.30 |
| Private/Commercial | 0.37 | 0.48 |
| Other government insurance | 0.02 | 0.15 |
| HMO/prepaid plan | 0.15 | 0.36 |
| Specialist | 0.68 | 0.46 |
| Northeast | 0.23 | 0.42 |
| Midwest | 0.25 | 0.44 |
| South | 0.28 | 0.45 |
| West | 0.24 | 0.43 |
Notes: Data source: NAMSC91. Sample size is 29,854. Sample size differs as we use data from a different year. However, the public data from 1989 (the one Hellerstein uses) allow for reproduction of Table 1. For further information see Table 1 notes in Hellerstein (1998); With the specifications stated in the manuscript, we cannot reproduce table 1 completely.
Table 2 shows very similar statistics for the patients of the NAMCSd sample compared to the 1989 data. We observe a smaller sample size in the 1991 data.
Hellerstein Table 2 - Summary Statistics for Patients in NAMCS Drug Sample
| Mean | Standard Deviation | Proportion Generic | |
|---|---|---|---|
| Age | 43.79 | 25.13 | |
| Female | 0.59 | 0.49 | 0.27 |
| Nonwhite | 0.12 | 0.32 | 0.34 |
| Hispanic | 0.06 | 0.24 | 0.33 |
| Self-Pay | 0.27 | 0.44 | 0.29 |
| Medicare | 0.15 | 0.36 | 0.21 |
| Medicaid | 0.11 | 0.31 | 0.32 |
| Private/Commercial | 0.33 | 0.47 | 0.27 |
| HMO/prepaid plan | 0.15 | 0.35 | 0.34 |
| Specialist | 0.60 | 0.49 | 0.26 |
| Northeast | 0.21 | 0.41 | 0.28 |
| Midwest | 0.27 | 0.44 | 0.27 |
| South | 0.29 | 0.46 | 0.25 |
| West | 0.23 | 0.42 | 0.35 |
| Full sample | 0.28 |
Notes: The sample size is 7,715. For further notes see Hellerstein (1998), Data source: NAMSCd91.
Table 3 shows the absolute number of observations and the share of generics over all drugs as well as the eight largest drug categories. We see an overall similar generic share over all drug classes compared to Hellerstein (1998). Yet in the drug class pain relief we see an increase of generic share by about \(9\) percentage points.
Hellerstein Table 3 - Frequency of Generic Prescription by Drug Class
| Observations | % Generics | |
|---|---|---|
| All drugs | 7715 | 28.37 |
| By drug class | ||
| Antimicrobials | 2955 | 40.37 |
| Cardiovascular-renals | 1344 | 16.15 |
| Central Nervous System | 789 | 25.48 |
| Hormones/Hormonal mechanisms | 917 | 35.66 |
| Skin/Mucous membrane | 530 | 9.06 |
| Ophthalmics | 295 | 13.90 |
| Pain relief | 634 | 21.29 |
| Respiratory tract | 251 | 10.76 |
The distribution of physicians over the different generic prescription rates (Figure ??) is similar to Hellerstein (1998).
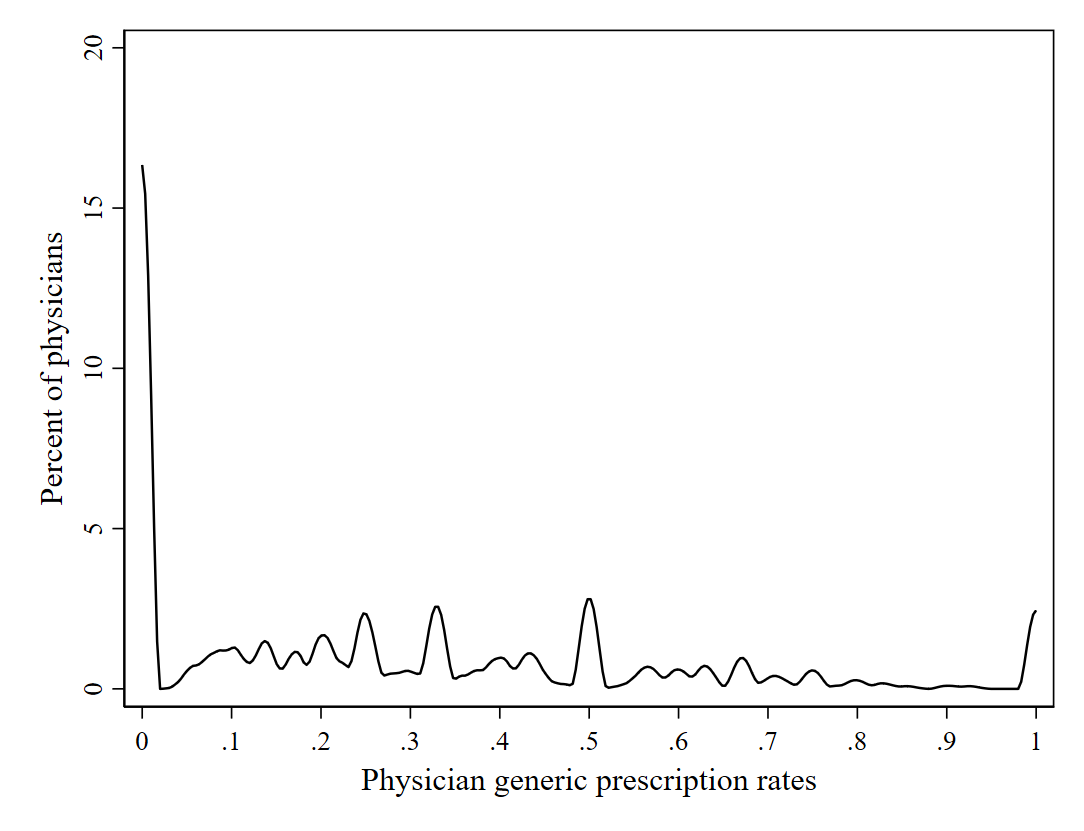
Figure 7.1: Hellerstein Figure 1 - Distribution of Physician Generic Prescription Rates (Source: NAMSCd91)
Figure 2
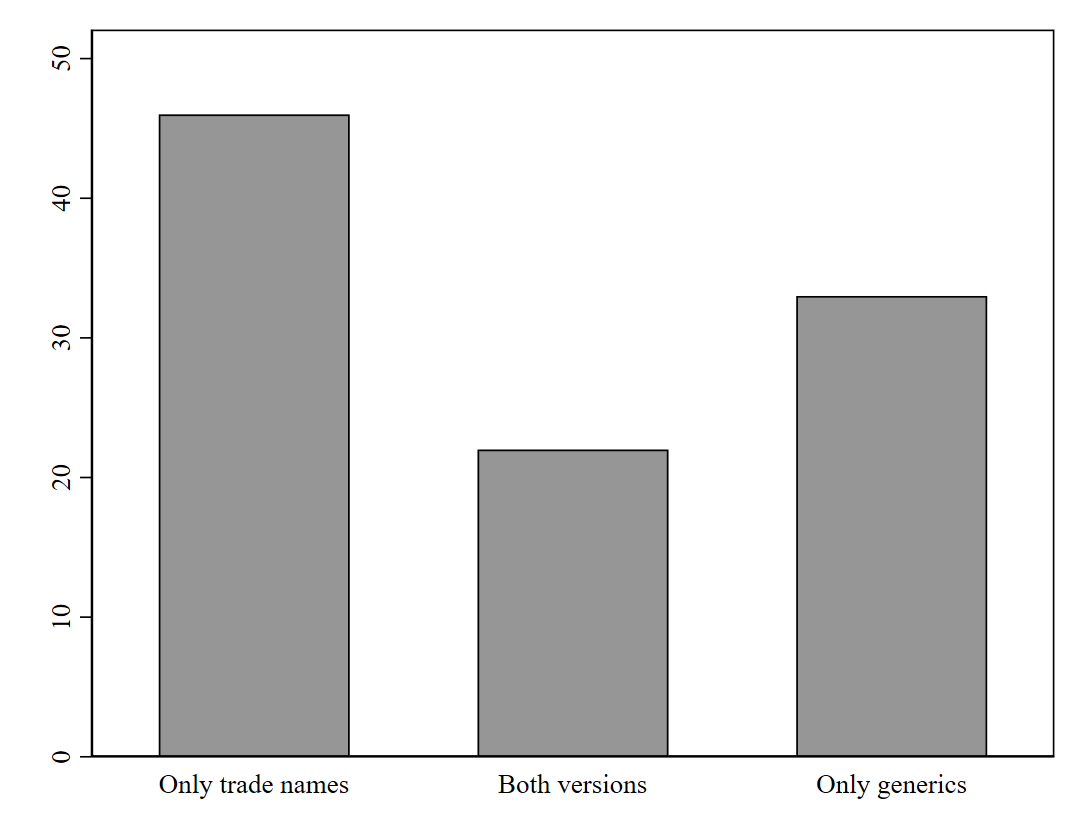
Figure 7.2: Hellerstein Figure 2 - Physician decisions by physicians who prescribe a drug to at least six patients (Source: NAMSCd91)
When looking at Figure ??, we see a decrease from about 90% to about 50% in “only trade-name” prescriptions by physicians. This seems to be driven by a rather small increase of prescription of “both versions” and “only generics”.
7.2 Empirical Analysis
Keep in mind that due to data restrictions, we were not able to control for certain covariates that Hellerstein (1998) includes. An example of such are legislation laws like mandatory or permissive substitution, and one- or two-line prescription. For this reason, we cannot present all tables produced by Hellerstein (1998). Given these restrictions, we cannot run the analysis with the same underlying model specifications.
This restricts us from comparing the results from 1991 and 1989. However, for the completion of this example we present the results from Tables 4, 5 and 6:
Hellerstein Table 4 - Estimated Coefficients on Demographic Variables, Geographic Variables, and Average Characteristics for Full Sample, excluding regional identifiers
| Random-Effects Probit Coefficient | Percent change in Generic | |||
|---|---|---|---|---|
| Constant | -0.556** | (-3.17) | ||
| Age | -0.002* | (-1.99) | -0.001* | (-1.99) |
| Female | -0.112** | (-2.94) | -0.028** | (-2.94) |
| Hispanic | 0.025 | (0.28) | 0.006 | (0.28) |
| Nonwhite | 0.044 | (0.62) | 0.011 | (0.62) |
| Specialist | 0.019 | (0.25) | 0.005 | (0.25) |
| Mean age | -0.003 | (-1.10) | -0.001 | (-1.10) |
| Percent female | -0.189 | (-1.16) | -0.048 | (-1.16) |
| Percent black | 0.075 | (0.41) | 0.019 | (0.41) |
| Percent Hispanic | -0.112 | (-0.45) | -0.028 | (-0.45) |
| Percent Medicaid | 0.062 | (0.26) | 0.016 | (0.26) |
| Percent Medicare | -0.155 | (-0.71) | -0.039 | (-0.71) |
| Percent private insured | 0.155 | (1.08) | 0.039 | (1.08) |
| Percent HMO/prepaid | 0.054 | (0.30) | 0.014 | (0.30) |
| Midwest | -0.141 | (-1.53) | -0.036 | (-1.53) |
| South | -0.206* | (-2.28) | -0.052* | (-2.29) |
| West | 0.065 | (0.67) | 0.016 | (0.67) |
Notes: \(*p < 0.05, **p < 0.01, ***p < 0.001\); The sample size is 7,715. For further notes see Hellerstein (1998). Data source: NAMSCd91.
Table 5 shows the estimated coefficients for the eight largest drug classes as well as the % change in the generic share. The greatest change compared to Hellerstein (1998) is the change in sign from positive to negative for cardiovascular/renals, though not significant in our model.
Hellerstein Table 5 - Estimated Coefficients for Drug-Class Dummy Variable for Full Sample
| Random-Effects Probit Coefficient | % Change in Generic | |||
|---|---|---|---|---|
| main | ||||
| Antimicrobials | 0.628*** | (8.47) | 0.159*** | (8.54) |
| Cardiovascular-renals | -0.147 | (-1.71) | -0.0371 | (-1.71) |
| Central Nervous System | 0.0559 | (0.58) | 0.0141 | (0.58) |
| Hormones/Hormonal mechanisms | 0.584*** | (6.92) | 0.148*** | (6.95) |
| Skin/Mucous membrane | -0.731*** | (-6.26) | -0.185*** | (-6.28) |
| Ophthalmics | -0.383* | (-2.47) | -0.0968* | (-2.47) |
| Resperatory tract | -0.675*** | (-4.79) | -0.171*** | (-4.80) |
Notes: \(*p < 0.05, **p < 0.01, ***p < 0.001\); The sample size is 7,715. Omitted category is pain relief. For further notes see Hellerstein (1998). Data source: NAMSCd91.
Hellerstein Table 6 - Tests for Moral Hazard for the Full Sample Equality of Individual Insurance Variables with Self-Payment Random-Effects Probit Results
| Antimicrobial | % change | Cardiovasculars | % change | Central Nervous System | % change | Hormones | % change | Skin/Muchous Membranes | % change | Ophthalmics | % change | Pain relief | % change | Respiratory Tract | % change | |
|---|---|---|---|---|---|---|---|---|---|---|---|---|---|---|---|---|
| Medicaid | ||||||||||||||||
| Coefficient | 0.14 | 0.04 | 0.00 | 0.00 | 0.02 | 0.00 | 0.38 | 0.08 | 0.03 | 0.00 | -0.25 | -0.05 | 0.54 | 0.08 | -1.21 | -0.09 |
| 1.12 | 1.13 | 0.02 | 0.02 | 0.08 | 0.08 | 1.23 | 1.23 | 0.04 | 0.04 | -0.60 | -0.60 | 1.12 | 1.15 | -1.08 | -1.11 | |
| Medicare | ||||||||||||||||
| Coefficient | 0.11 | 0.03 | 0.05 | 0.01 | -0.32 | -0.06 | -0.42 | -0.09 | 0.54 | 0.05 | -0.41 | -0.08 | 0.08 | 0.01 | -0.60 | -0.05 |
| 0.72 | 0.72 | 0.25 | 0.25 | -1.13 | -1.12 | -1.68 | -1.69 | 0.89 | 0.90 | -0.97 | -0.97 | 0.18 | 0.18 | -0.67 | -0.68 | |
| Private | ||||||||||||||||
| Coefficient | 0.00 | 0.00 | -0.06 | -0.01 | -0.06 | -0.01 | -0.16 | -0.03 | 0.03 | 0.00 | -0.31 | -0.06 | 0.18 | 0.03 | -1.27 | -0.10 |
| 0.01 | 0.01 | -0.30 | -0.30 | -0.28 | -0.28 | -0.75 | -0.75 | 0.07 | 0.07 | -0.91 | -0.91 | 0.51 | 0.51 | -1.45 | -1.56 | |
| HMO/Prepaid | ||||||||||||||||
| Coefficient | 0.22 | 0.06 | -0.14 | -0.03 | 0.32 | 0.06 | -0.33 | -0.07 | -0.42 | -0.04 | -0.57 | -0.11 | 0.28 | 0.04 | -0.26 | -0.02 |
| 1.78 | 1.78 | -0.56 | -0.56 | 1.04 | 1.05 | -1.09 | -1.09 | -0.73 | -0.73 | -0.93 | -0.93 | 0.71 | 0.72 | -0.26 | -0.25 |
Notes: see Hellerstein (1998). Data source: NAMSCd91.